


MyCourses: Reports and logs

In short
- MyCourses provides detailed log information about users' activities in the course workspace.
- MyCourses includes Intelliboard activity reports for teachers and students.
- The teacher metrics supports the instructor in monitoring course activities and developing courses.
- The learner metrics helps students track their own course activities and upcoming course assignments.
- All report data is based on MyCourses course logs, and data is not transferred outside of MyCourses.
Log Information
Information on events in the course workspace is saved in a logs. Teachers can view the events from the Reports tab in the workspace's top navigation. From the log data, you can search for information based on activity, student, or date. Log information can be utilized in trouble-shooting cases.
Read more in Moodle.org: Logs
Course Activity Reports for Teachers and Students (Intelliboard)
Implementing metrics
To produce data on course activities in MyCourses workspace for teacher metrics (and learner metrics for students), the following actions should be taken:
- The course workspace should have enough activities to be tracked, and student progress should be enabled in activities.
- Completion tracking should be enabled in the course settings.
- Assignment evaluation settings need to be made.
Read more in MyCourses help: Tracking assignment activities.
Note: If the Teacher metrics seems to have missing data about previous courses, completion tracking has not been activated in MyCourses.
Teacher metrics: Content and Instructions
General Structure and Content
Teacher metrics can be found in MyCourses top menu -> Intelliboard. It contains three views: Dashboard, Courses, and Reports. Intelliboard is an analytics tool intended for MyCourses that produces the Teacher metrics. Note that Intelliboard refers to the same tool as Instructor Dashboard.
- The summary chart on the dashboard provides information on ongoing and previous courses.
- The dashboard also offers data on course assignments, grade progression, time spent on various course activities, and the average grade for the selected course.
- The courses view displays information on the current state of students and activities.
- The reports view provides additional information in separate reports.
- Different views are explained in more detail below.
Read more on Intelliboard pages.
Dashboard View
- The summary on the dashboard displays charts on learner progression, grade progression, activity progression, and course overview.
- The Correlations & Students Engagement correlation chart shows the relationship between the course average and the total time spent by the learner.
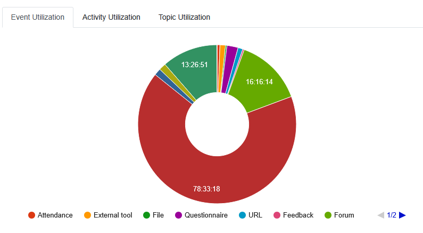
- Time usage, activity usage, and section usage pie charts show the time learners spend on courses, course activities, or course topics during a selected period.
- The overall view of graded activities vertical bar chart shows the average grades for the course.


Courses View
Courses show the following information for all of the teacher's courses:
- Course name: the course name as recorded in MyCourses; clicking the hyperlink opens the course in MyCourses.
- Enrolled/completed students: The first number is the number of students in the course; the second number is the number of students who have completed the course. The blue bar is a graphical representation of completed students.
- Visits: total number of visits (mouse clicks) by learners on the course.
- Time spent: total time spent on the course (hh:mm:ss; hours: minutes: seconds).
- Average visits per student: average number of visits by students on the course.
- Activities: Click the Students or Activities button for more information.
The Students button provides information about individual students:
- Student name: the student's name as recorded in MyCourses
- Email address: the student's email address as recorded in MyCourses
- Enrolled: date when the learner enrolled in the course
- Last access: date when the student last logged into the course
- Grade: the student's current grade in the course
- Completed activities/resources: the number of activities/resources completed by the student
- Visits: the number of visits the student has made to the course
- Time spent: the time the learner has spent in the course (hh:mm:ss; hours: minutes: seconds)
- Average visits per student: the average number of visits the student has made to the course
- Average time spent per student: the average time spent in the course per student (hh:mm:ss; hours: minutes: seconds)
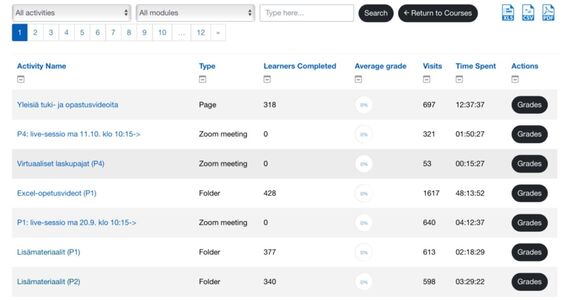
The Activities button provides detailed information about course activities:
- Activities: Click the "Activities" button to get more information about activities in a specific course.
- Activities: Then click the "Grades" button to get information about individual students and activities.
Reports View
The reports view provides additional information in separate reports.
- Activity grades with dates: the report shows individual learner grades for specific activities from selected courses.
- Activity stats summary: shows cumulative data on activities used in each course.
- Teacher assessed assignments: user grades for assignments and assessor's name.
- Course rules utilization: time learners spent on course content/events/activities.
- Course inactivity: courses without learner activity during defined periods.
- Summary of student forum participation: displays forum activity, time of day.
- Student success and progress: the report shows learner progress accumulated in the course, which can be filtered by grade. This report is used to identify at-risk learners.
- Grading required: the report shows activities submitted by students that still require evaluation in the LMS.
- User access analytics: shows when courses are accessed during a user-selected period. Data is displayed.