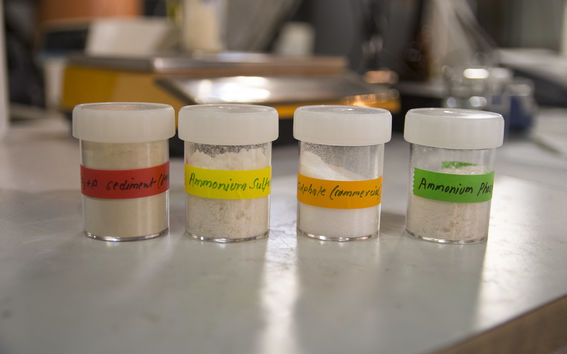
NPHarvest process has been optimized for membrane stripping and pretreatment with several different wastewater streams. The results can be found in publications section. Most recent development concerns use of natural coagulants and further optimization for membrane performance.
Considering the pre-treatment unit, the possibility to use natural coagulants has been studied. Wastewater streams considered are reject water from Viikinmäki wastewater treatment plant (already tested with the pilot) and Ämmässuo landfill leachate being it the new wastewater stream to be tested with the pilot. Among the natural coagulants available on the market, tannin-based and starch-based ones were provided to be tested in lab with jar tests. After screening tests starch-based coagulant PrimePHASE 3545 was selected to be used with Viikinmäki reject water, while the tannin-based coagulant HTH was selected to be used to treat landfill leachate. By using Design Expert software, Response Surface Methodology was applied to model the parameters selected to evaluate the effectiveness of the treatment. Optimization of the process based on generated models gave best combination of dose and pH, and the corresponding predicted values for each parameter. Parameters for optimization are all set to minimum concentration, while ammonia nitrogen and TN are set at maximum concentration. Results are as following:
Viikinmäki
pH range: 8-10
Dosage range: 10-20 ml/l (25% diluted solution)
Scenario A: With the software we set the best combination for dose and pH in order to remove the measured variables.
|
Scenario B: We wanted to have highest possible pH and lowest possible dosage.
|
- pH: 8.9
- Dosage: 18.5 ml/l
|
- pH: 9.1
- Dosage: 14.1 ml/l
|
|
|
SCENARIO A
|
SCENARIO B
|
|
RAW concentration (mg/l)
|
Predicted concentration (mg/l)
|
Removal predicted (%)
|
Predicted concentration (mg/l)
|
Removal predicted (%)
|
TN
|
1231
|
1108.53
|
-9.95
|
1119.46
|
-9.06
|
TP
|
12.75
|
2.28
|
-82.13
|
3.14
|
-75.40
|
DOC
|
1202
|
942.05
|
-21.63
|
995.45
|
-17.18
|
VS
|
985.71
|
126.28
|
-87.19
|
165.51
|
-83.21
|
SS
|
1100
|
129.89
|
-88.19
|
181.18
|
-83.53
|
Ammonia-N
|
688.32
|
900.28
|
+30.79
|
909.86
|
+32.19
|
Ämmässuo alkaline pH
pH range: 8-10
Dosage range: 5-10 ml/l
Scenario A: With the software we set the best combination for dose and pH in order to remove the measured variables.
|
Scenario B: We wanted to have highest possible pH and lowest possible dosage.
|
|
|
|
|
Scenario A
|
Scenario B
|
|
RAW concentration (mg/l)
|
Predicted concentration (mg/l)
|
Removal (%)
|
Predicted concentration (mg/l)
|
Removal (%)
|
TN
|
1019.00
|
1046.28
|
+2.68
|
1001.72
|
-1.70
|
TP
|
7.74
|
5.57
|
-28.06
|
6.08
|
-21.43
|
DOC
|
1189.00
|
1421.82
|
+19.58
|
1315.46
|
+10.64
|
VS
|
25.00
|
28.51
|
+14.04
|
29.24
|
+16.96
|
SS
|
20.00
|
20.73
|
+3.63
|
26.11
|
+30.53
|
NH4+-N
|
535.82
|
637.56
|
+18.99
|
665.47
|
+24.20
|
Ämmässuo neutral/acidic pH
pH range: 6-8
Dosage range: 5-20 ml/l
Scenario A: With the software we set the best combination for dose and pH in order to remove the measured variables.
|
Scenario B: We wanted to have highest possible pH and lowest possible dosage.
|
- pH: 6.7
- Dosage: 17.3 ml/l
|
- pH: 7.4
- Dosage: 11.3 ml/l
|
|
|
Scenario A
|
Scenario B
|
|
Raw- concentration (mg/l)
|
Predicted concentration (mg/l)
|
Removal (%)
|
Predicted concentration (mg/l)
|
Removal (%)
|
TN
|
1019.00
|
1069.13
|
+4.92
|
1057.06
|
+3.74
|
TP
|
7.74
|
3.50
|
-54.75
|
3.90
|
-49.57
|
DOC
|
1189.00
|
781.57
|
-34.27
|
983.87
|
-17.25
|
VS
|
25.00
|
13.25
|
-47.00
|
18.83
|
-24.67
|
SS
|
20.00
|
16.36
|
-18.20
|
21.35
|
+6.77
|
Ammonia-N
|
535.82
|
463.76
|
+18.99
|
665.47
|
+24.20
|