Astroinformatics (external link)
Simulations of turbulence and magnetism in astrophysical objects

Every 11 years the Sun is in a state of minimum magnetic activity. During those quiet phases, the entire solar surface consists of an undisturbed pattern of ~1 Mm2 sized granulation cells with lifetimes in the range of 10 minutes, organised within supergranular, 40 Mm large cells outlined by magnetic fields of kilo-Gauss strength, the so-called network fields. Larger magnetic active regions, which dominate the solar scene during the activity maximum, are absent. But even during solar maximum, more than 90 percent of the solar surface is in the quiet state, apparently indistinguishable from the quiet Sun at solar minimum. In this study we address the question, whether or not the properties of these quiet regions are really the same throughout the whole activity cycle, or if there are subtle differences. Answering this question sets important constraints for the relative importance of the two dynamo mechanisms believed to operate in the solar convection zone: the turbulent small-scale dynamo, responsible for the omnipresent small-scale magnetic fields, and the large-scale dynamo responsible for the solar activity cycle.
Data from the HMI instrument on board the Solar Dynamics Observatory (NASA) now cover a time span slightly longer than one activity cycle and provide a unique opportunity to answer this question. We developed a data pipeline which automatically processed the line-of-sight full disk velocity maps, retrieved every 45 s by the HMI instrument. From these data, we derived the solar cycle variation of the surface gravity waves, the so-called f-mode. According to theory, the f-mode energy is altered by sub-surface magnetic fields. Therefore, a solar-cycle dependence of the f-mode energy should be a good indicator for the changes of the magnetic field topology in the near-surface shear layer.
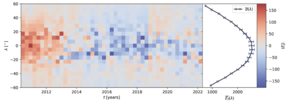
We computed the f-mode energy for quiet 15 degree sized patches for solar latitudes up to ±60 degrees. This results in a butterfly diagram of the f-mode energy, presented in Figure 1. A variation of the energy is clearly visible: as predicted by theory, the f-mode energy is suppressed during the time of the solar maximum. The highest energy is observed during the minimum in 2010 and 2011, but surprisingly the f-mode energy did not recover to this level at low latitudes during the following minimum around 2020. This behaviour remains enigmatic and it will be interesting to follow this phenomenon with future HMI measurements.

Simulations of turbulence and magnetism in astrophysical objects
We are an internationally-oriented community and home to world-class research in modern computer science.