Key figures of 2023 and annual reports

Research
- The quality of research developed positively.
- The impact of the university’s publication activities is high.
- The university published 2 176 international refereed articles in scientific journals.

Quality of publications
2015–2023
Share of Aalto University publications that belong to the top 10% most highly cited publications in the world in the same subject area. This indicator has been used since 2015.

International academic faculty (%)
2014–2023

International peer-reviewed articles in scientific journals
2014–2023

Artistic outputs
2014–2023
Includes artistic publications, exhibitions and performances.

Competitive research funding (€ million)
2014–2023
International funding includes competitive EU funding and funding from foreign funds and foundations. Other funding includes funding from the Research Council of Finland, Business Finland and companies.
Excellence in research
| 2014 | 2015 | 2016 | 2017 | 2018 | 2019 | 2020 | 2021 | 2022 | 2023 | |
|---|---|---|---|---|---|---|---|---|---|---|
| Recipients of European Research Council (ERC) funding | 16 | 17 | 21 | 26 | 26 | 24 | 27 | 28 | 27 | 22 |
| Research Council of Finland Centres of Excellence | 7 | 7 | 7 | 7 | 6 | 6 | 3 | 3 | 7 | 7 |
| Research Council of Finland Flagships |
- | - | - | - | - | 3 | 4 | 4 | 4 | 8 |
| Research Council of Finland Academy Professors |
7 | 6 | 7 | 5 | 5 | 5 | 4 | 2 | 1 | 1 |
| Research Council of Finland Research Fellows |
36 | 34 | 38 | 40 | 41 | 44 | 44 | 49 | 48 | 57 |
Professors
- At the end of 2023, the university had 413 professors, of whom 334 had been appointed since the establishment of Aalto University.
| 2014 | 2015 | 2016 | 2017 | 2018 | 2019 | 2020 | 2021 | 2022 | 2023 | |
|---|---|---|---|---|---|---|---|---|---|---|
| Professors | 369 | 388 | 386 | 386 | 389 | 390 | 393 | 395 | 404 | 413 |
| International | 17% | 18% | 20% | 22% | 24% | 24% | 26% | 27% | 27% | 28% |
| Women | 17% | 20% | 19% | 20% | 20% | 21% | 20% | 22% | 24% | 24% |
Education
- We work to meet future skills needs by providing pioneering education, which also opens up a broad range of opportunities for lifewide learning

Bachelor's degrees
2014–2023

Bachelor's graduate survey
2014–2023
Average score given by Aalto University bachelor's graduates in the national feedback survey on a scale of 1 to 5.

Master's degrees
2014–2023

Doctoral degrees
2014–2023

Bachelor’s and master’s degree students
2023
*Full-time equivalent degree students
Impact
- Our world-class innovation ecosystem is characterised by a multidisciplinary approach, collaboration, openness, startup entrepreneurship, and a wide range of student activities.

Corporate collaboration volume (€ million)
The total amount of corporate income in Aalto University Group. The figure excludes all IPR commercialisation income. The indicator has been calculated since 2015.

IP portfolio return, net of fees (€ million)
Includes income relating to IPR and technology transfers and changes in fair value. IP portfolio's costs are deducted from the income.
Enabling our success
- Equality, diversity and inclusion support the wellbeing and creativity of the community and its ability to promote world-class research, education and impact.
- The university had 4 884 personnel at year-end, 59% of them were employed in teaching and research positions.
- The long-term campus development programme continued.

Personnel wellbeing survey
Average of all answers received in the survey on a scale of 1 to 5. The survey is carried out every two years.

Personnel structure development
2014–2023

Number of personnel
31 Dec 2023
Developing campus
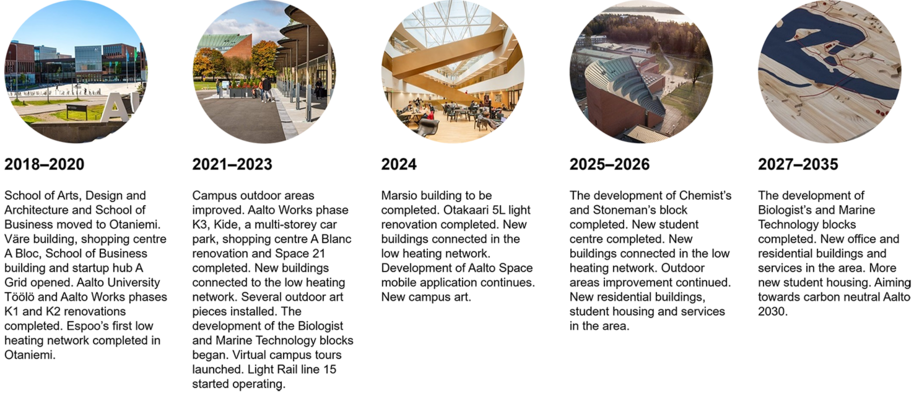

Campus roadmap
Current and future buildings and blocks in the Otaniemi campus area.

Facility usage (1000 sqm)
2014–2023

Facility costs (€ million)
2014–2023

Total CO2 emissions (tCO2e)
2023

CO2 emissions from buildings (tCO2e)
2019–2023
Amount of carbon dioxide emissions from energy consumption in university buildings. As of 2021, this indicator is calculated in a new way using the benefit sharing calculation method in regard to the consumed district heating.
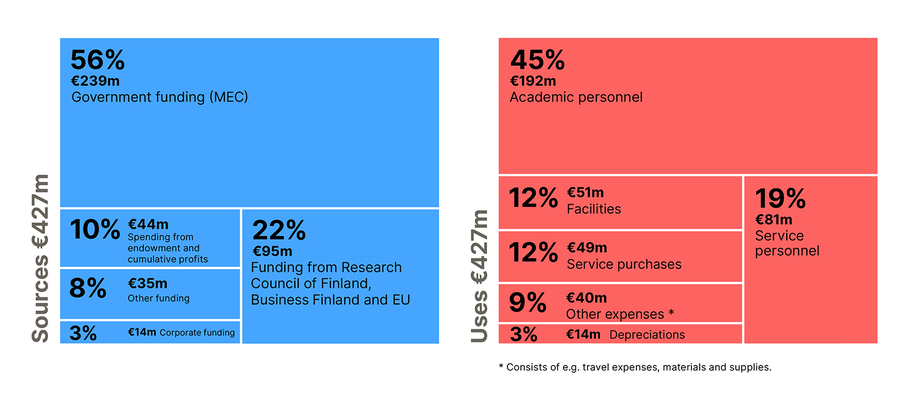
Sources and uses of funding (€ million)
2023

Sources of funds (€ million)
2014–2023

Uses of funds (€ million)
2014–2023

Government funding from MEC (€ million)
2010–2023
Group key financial figures (€ million)
Profit and loss
| 2022 | 2023 | |
|---|---|---|
| Turnover | 383 | 403 |
| Expenses | 418 | 440 |
| Operating profit/loss | -35 | -37 |
| Fundraising profit/loss | 10 | 4 |
| Endowment profit/loss | -42 | 102 |
| Financing profit/loss | 9 | -17 |
| Net profit/loss | -67 | 49 |
| Net profit-% | -18% | 12% |
Balance sheet
| 2022 | 2023 | |
|---|---|---|
| Noncurrent assets | 1852 | 1959 |
| Intangible assets | 2 | 2 |
| Tangible assets | 575 | 594 |
| Investments | 1275 | 1362 |
| Current assets | 184 | 121 |
| Total | 2036 | 2080 |
| Equity | 1558 | 1609 |
| Liabilities | 478 | 471 |
| Interest bearing liabilities | 321 | 306 |
| Non-interest bearing liabilities | 157 | 165 |
| Total | 2036 | 2080 |
| Equity ratio | 77% | 77% |
University news
Board approved Annual Board Report and Financial Statements 2023 and appointed Raili Pönni as Development Director
The Aalto University Board convened on 19 March 2024.
Aalto University endowment provided EUR 37 million in 2023 to education and research
Endowment investment portfolio return was 8.1%
Aalto University was recognised in national and international evaluations in 2023
University board approved the Annual Board Report and Financial Statements for 2023
Aalto University endowment returned 3.2% during first half of 2023
Endowment provides EUR 34 million to fund research and education this yearAnnual reports from 2010-2022
Aalto University Annual Board Report and Financial Statements 2022 (pdf)
Aalto University Annual Board Report and Financial Statements 2021 (pdf)Aalto University Annual Board Report and Financial Statements 2020 (pdf)
Aalto University Annual Board Report and Financial Statements 2019 (pdf)
Aalto University Annual Board Report and Financial Statements 2018 (pdf)
Aalto University Annual Board Report and Financial Statements 2017 (pdf)
Aalto University Annual Board Report and Financial Statements 2016 (pdf)
Aalto University Annual Board Report and Financial Statements 2015 (pdf)
Aalto University Annual Report 2014 (pdf)
Aalto University Annual Report 2013 (pdf)
Aalto University Annual Report 2012 (pdf)
Aalto University Foundation's Board Report and Financial Statements 2011 (pdf)
Aalto University: Aalto's year 2010 in Review (pdf)
Aalto University Foundation's Board Report and Financial Statements 2010 (pdf)
Web materials from previous years
Aalto University 2022, website
Aalto University 2021, website
Aalto University 2020, website
Aalto University 2019, website
Aalto University in 2018, website
Aalto University in 2017, website
Auditor's reports
Aalto University Foundation, 2020-2023
- Published:
- Updated: